The flakiness index measures the proportion of thin, flat particles in a coarse aggregate sample. It is commonly used to evaluate aggregates intended for concrete, asphalt, road base and other construction applications.
A high result may indicate an unsuitable particle shape, but it does not automatically identify the cause. The result may be affected by the parent rock, sampling method, test standard, feed gradation, crusher operating condition, chamber profile, liner wear or the arrangement of the crushing circuit.
This guide explains the basic test principle and focuses on a question that is more important to aggregate producers:
Why does a crushing plant produce flaky aggregate, and what should operators check before changing the equipment?
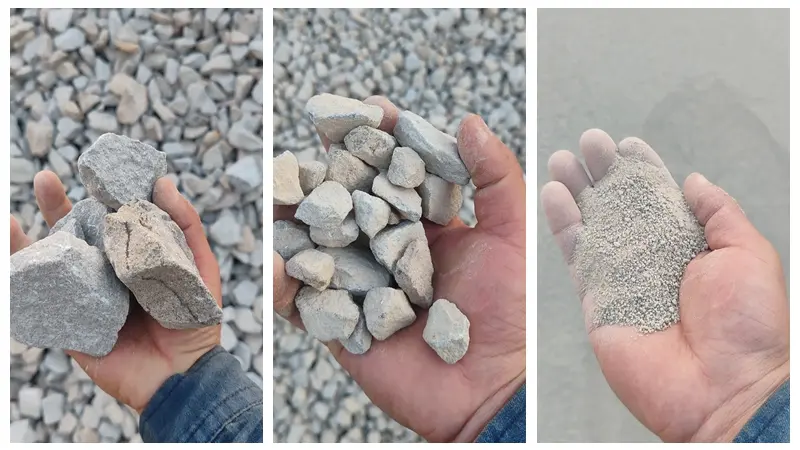
What Is the Flakiness Index of Aggregate?
A flaky particle has a relatively small thickness compared with its other dimensions. The flakiness index expresses the mass of particles classified as flaky as a percentage of the applicable aggregate sample.
A general expression is:
Flakiness Index (%) =
Mass of particles classified as flaky
÷
Total mass of the applicable test fractions
× 100
The formula appears simple, but the result is only meaningful when the following information is also known:
Test standard and edition;
Applicable aggregate size fractions;
Sampling location;
Sample preparation method;
Type of gauge or bar sieve;
Intended use of the aggregate;
Acceptance limit stated in the project specification.
The flakiness index is primarily a coarse-aggregate particle-shape indicator. It is not a replacement for grading, abrasion, strength, water absorption or durability testing.
Fine material such as a 0–5 mm manufactured-sand product normally requires other quality assessments. These may include grading, fines content, particle shape and tests specified by the applicable project standard. For a broader discussion, see the guide to manufactured sand quality requirements.
Flakiness Index vs Elongation Index
Flakiness and elongation both describe undesirable particle proportions, but they are not the same measurement.
| Indicator | Particle characteristic | Typical assessment |
|---|---|---|
| Flakiness index | A particle is excessively thin or flat | Thickness gauge or specified bar sieve |
| Elongation index | A particle is excessively long | Length gauge |
| Flat and elongated particles | The ratio between maximum and minimum dimensions exceeds the specified value | Proportional caliper |
A particle may be flaky, elongated or both. The calculation and reporting method depend on the governing standard.
The article should therefore not use “flakiness index,” “elongation index” and “flat and elongated particle percentage” as interchangeable terms.
Which Test Standard Should Be Used?
There is no single testing method used by every country and project.
BS EN 933-3
BS EN 933-3 covers the determination of particle shape by the flakiness index and uses specified bar sieves for the applicable size fractions. It forms part of the broader BS EN 933 aggregate geometrical-properties series.
IS 2386 Part 1
IS 2386 Part 1 is widely referenced in India and some international projects. Under this method, particles are divided into specified size fractions and assessed using the corresponding thickness gauge.
The frequently quoted definition based on a particle thickness below 0.6 times its mean size belongs to this testing context. It should not be presented as a universal rule for every standard.
ASTM D4791
ASTM D4791 determines the percentages of flat particles, elongated particles, or particles that are both flat and elongated in coarse aggregate. It uses procedures that differ from the EN and IS flakiness-index methods.
Results obtained under these standards should not be compared unless the methods, tested fractions and reporting bases are equivalent.
Before interpreting a result, confirm which standard is required by the customer, consultant, road authority or construction contract.
How Is the Flakiness Index Tested?
The exact procedure must follow the specified standard, but a typical test includes the following stages:
Collect a representative coarse-aggregate sample.
Prepare the sample according to the required method.
Separate the aggregate into specified size fractions.
Weigh the fractions included in the test.
Check the particles using the appropriate thickness gauge or bar sieve.
Weigh the particles classified as flaky.
Calculate and report the result.
Record the result for each applicable fraction where required.
Testing each product fraction separately is valuable for crushing-plant diagnosis. A single combined value may hide an abnormal result in one particular size range.
For example, a plant producing 5–10 mm, 10–20 mm and 20–40 mm aggregate should not assume that all three fractions have the same particle-shape condition.
What Does a High Flakiness Index Mean?
A high result indicates that the tested sample contains a relatively high proportion of thin or flat particles under the selected test method.
Depending on the application, excessive flaky particles may affect:
Aggregate packing;
Compaction;
Mixture workability;
Particle breakage during handling or compaction;
Interlocking in an unbound layer;
Consistency between production batches.
However, the flakiness index does not provide a complete assessment of aggregate quality. It does not directly measure abrasion resistance, compressive strength, mineral durability or grading compliance.
There is also no universal FI limit for every aggregate product. The acceptable result depends on:
The governing standard;
Concrete, asphalt or road-base application;
Nominal aggregate size;
National or local specifications;
Customer and project requirements.
A report should state the applied specification instead of declaring that one number is acceptable worldwide.
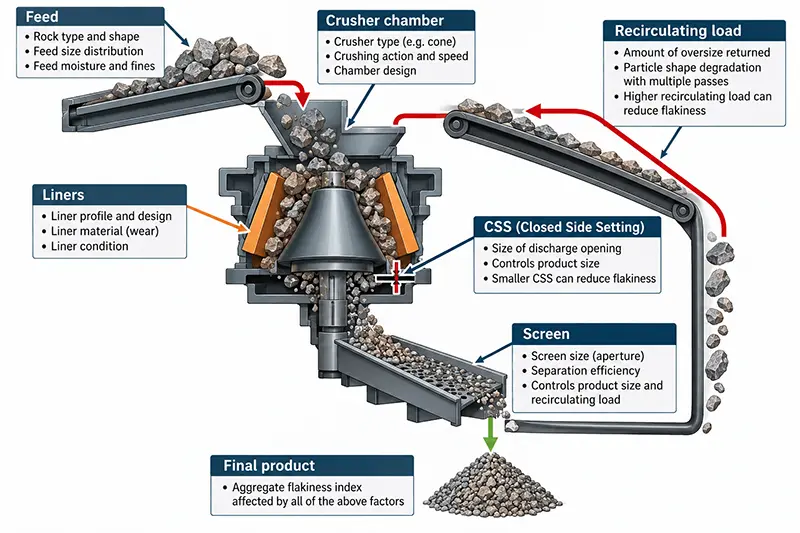
Why Does a Crusher Produce Flaky Aggregate?
1. Parent Rock Structure
Particle shape begins with the rock itself.
Hardness alone does not predict how a rock will fracture. Bedding, foliation, mineral orientation, weathering and natural discontinuities can encourage the material to split into flat pieces.
If the quarry face or raw-material source changes, the product shape may also change even when the crusher settings remain the same.
Operators should therefore compare high-FI results with:
Quarry face or source area;
Rock type;
Visible bedding or cleavage;
Moisture and weathering;
Feed-size distribution.
2. Unstable or Uneven Feeding
A crusher is unlikely to produce consistent aggregate when the feed is irregular.
Potential problems include:
Intermittent feeding;
Material entering from one side;
Excessive segregation before the crusher;
Feed containing too many fines;
Feed that is too coarse for the selected chamber;
Large changes in feed-size distribution.
Uneven feeding can change how particles interact inside the chamber. It may also cause uneven liner wear and inconsistent product shape.
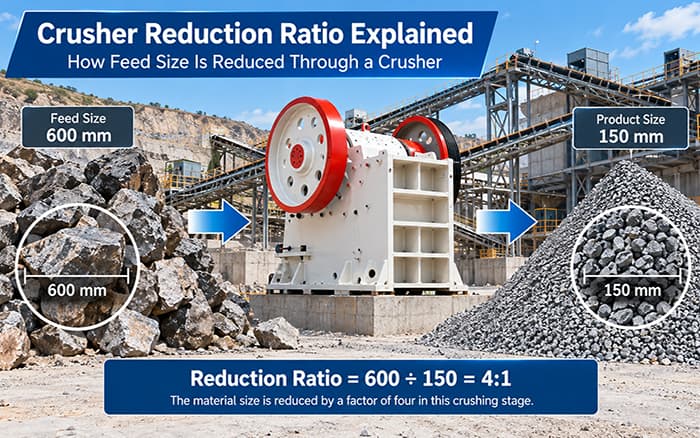
3. Incorrect Reduction Ratio
Trying to achieve too much size reduction in one crushing stage can reduce process stability and make particle-shape control more difficult.
The required reduction should be distributed between suitable crushing stages. The guide to crusher reduction ratio explains how feed size, product size and the number of stages are related.
The lowest-cost flow sheet is not always the one with the fewest machines. A circuit that forces one crusher to perform excessive reduction may create problems with capacity, wear, fines or particle shape.
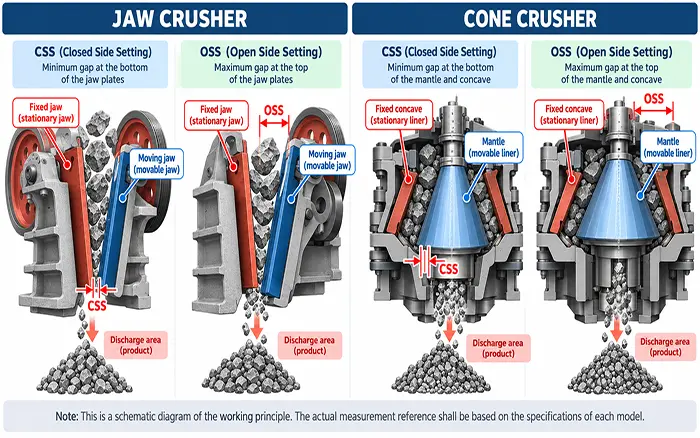
4. Closed Side Setting
The closed side setting affects product size, crushing ratio, chamber behaviour and circulating load.
However, operators should not assume that reducing CSS always improves aggregate shape. The result depends on:
Crusher type;
Chamber profile;
Feed size;
Material properties;
Liner condition;
Chamber loading;
Downstream screening.
CSS should be measured physically using the procedure approved for the machine. A control-panel setting may not represent the actual operating gap.
For definitions and measurement considerations, see closed side setting.
5. Worn or Unsuitable Liners
As liners wear, the effective chamber profile changes. This can affect:
Material grip;
Compression conditions;
Residence time;
Product gradation;
Power draw;
Particle shape.
A plant should not rely only on liner operating hours. The liner profile, wear distribution, remaining thickness and corresponding changes in product quality should also be recorded.
Uneven wear may indicate biased feeding, incorrect installation or an unsuitable chamber configuration.
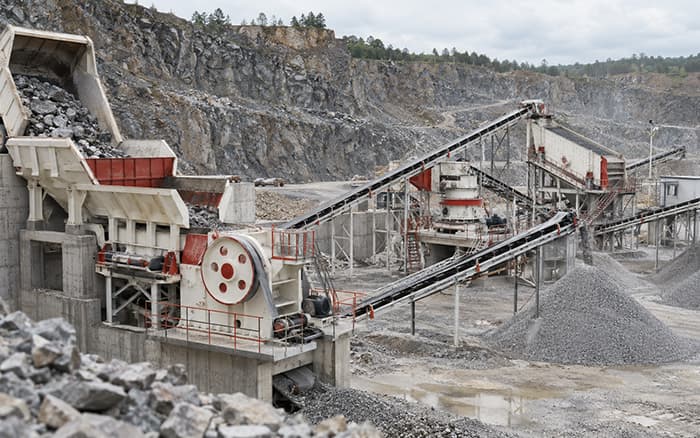
6. Crusher Type and Circuit Arrangement
Different machines perform different roles.
A jaw crusher is normally selected for robust primary size reduction. It should not automatically be expected to produce the final commercial particle shape in a single stage.
Cone crushers can provide efficient secondary and tertiary crushing, but the result depends on feed condition, chamber selection, CSS and liner state.
Impact crushers and VSI machines may provide an additional shaping stage. However, the actual result depends on material characteristics and operating parameters. Shaping can also change:
Fines generation;
Wear consumption;
Power demand;
Product yield;
Circulating load.
Research has found that feed gradation, feed rate, crusher setting and speed can influence the shape of jaw-crushed aggregate. Studies of cone crushing have also identified relationships between feed size, crusher setting and flakiness. These findings support process investigation, but they do not provide one universal setting for every crusher and material. Jaw-crusher parameter study, cone-crushing flakiness model
7. Screening and Recirculating Load
A crushing plant is a connected system.
Worn or damaged screen media may allow oversize material to enter a finished product. Poor classification may also change the load returning to the crusher.
When a high FI result is detected, inspect:
Screen apertures;
Broken or loose media;
Feed distribution across the deck;
Near-size material;
Recirculating-load changes;
Stockpile segregation;
Sampling position.
How to Diagnose a High Flakiness Index
| Observed condition | First checks | Recommended verification |
|---|---|---|
| FI increases in all finished fractions | Rock source, feed condition, chamber and liners | Compare quarry source and operating records |
| Only one fraction has a high result | Screening, sampling and recirculation | Retest that fraction using representative samples |
| FI increases after liner replacement | Liner profile, installation and initial CSS | Verify part specification and measured setting |
| Capacity and particle shape deteriorate together | Feed rate, chamber loading and blockage | Compare power, material level and feed records |
| Shaping lowers FI but increases fines | VSI condition, speed, circulation and product split | Measure both FI and saleable yield |
| Results vary between shifts | Operating settings and sampling consistency | Compare shift records and sampling locations |
The investigation should begin with confirmation of the test and sample. Changing crusher settings before verifying the result may introduce a new operating problem without correcting the original cause.
How to Reduce Flaky Particles in a Crushing Plant
Step 1: Verify the Test
Confirm:
Test standard;
Sample identity;
Product fraction;
Sampling position;
Laboratory method;
Calculation;
Applicable project limit.
If two reports use different standards or size fractions, the numbers may not be comparable.
Step 2: Test Each Product Fraction
Separate results for 5–10 mm, 10–20 mm and 20–40 mm products can reveal where the problem is concentrated.
Do not use a visual inspection of the stockpile as a substitute for representative sampling.
Step 3: Check the Raw Material
Determine whether the quarry source, rock structure or feed gradation has changed.
A process adjustment cannot completely remove a particle-shape tendency caused by strongly layered or naturally platy rock.
Step 4: Stabilize the Feed
Improve:
Feed continuity;
Distribution across the crusher opening;
Scalping where required;
Control of excessive fines;
Feed-size consistency.
Step 5: Measure CSS and Inspect Liners
Record actual CSS and compare the liner profile with the approved drawing or wear limits.
Do not adjust CSS beyond the operating range specified for the machine.
Step 6: Review the Number of Crushing Stages
Check whether one machine is being required to perform excessive reduction.
The overall aggregate production process should distribute coarse crushing, secondary reduction, shaping and classification according to the feed and product requirements.
Step 7: Evaluate a Shaping Stage
Where commercial specifications require improved particle shape, a VSI or suitable impact-crushing stage may be evaluated.
The decision should consider:
Material abrasiveness;
Required product fractions;
Target capacity;
Allowable fines;
Wear cost;
Existing circulating load.
Step 8: Retest After Stabilization
After an adjustment, allow the plant to reach a stable operating condition before collecting a new sample.
Compare more than the FI result. Also record:
Throughput;
Product yield;
Fines percentage;
Power;
Wear;
Screen load;
Recirculating load.
Field Example: 200 TPH Hard Sandstone Aggregate Plant in Cambodia
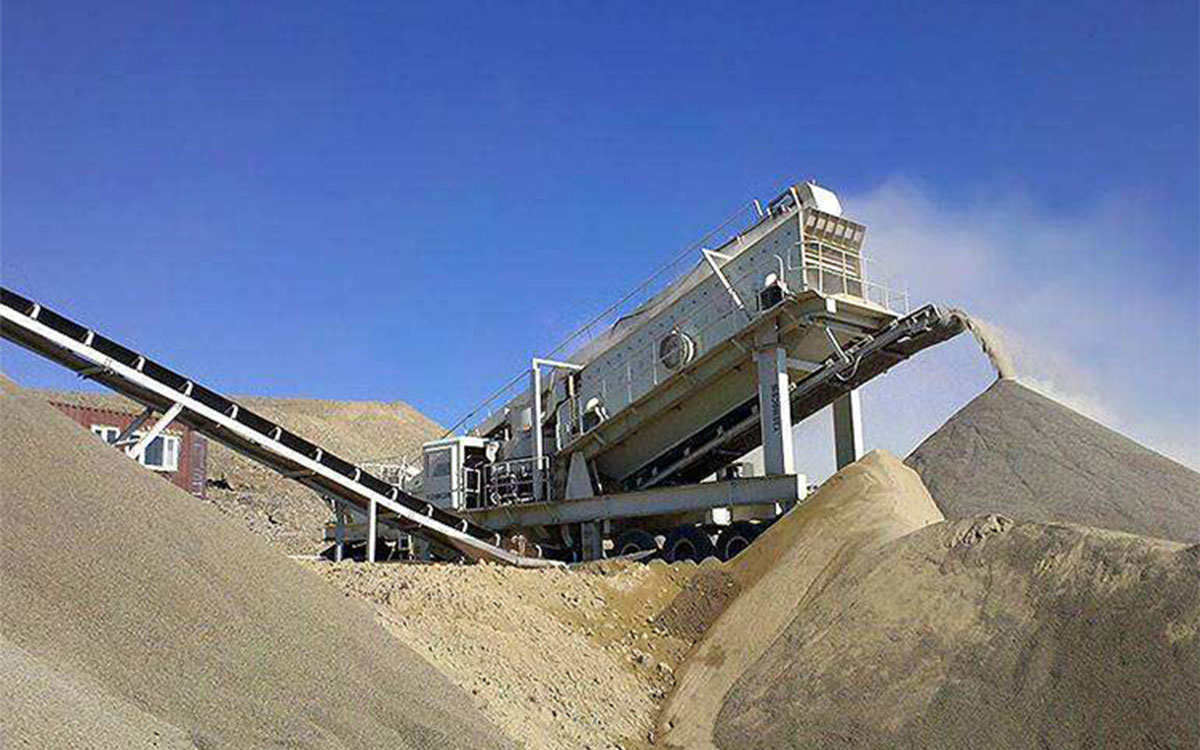
A 200 TPH hard sandstone aggregate production line in Cambodia illustrates how crushing and shaping duties can be separated between multiple stages.
The documented project information includes:
| Project item | Confirmed information |
|---|---|
| Material | Hard sandstone |
| Design capacity | 200 TPH |
| Maximum feed size | ≤500 mm |
| Finished products | 0–5, 5–10, 10–20 and 20–40 mm |
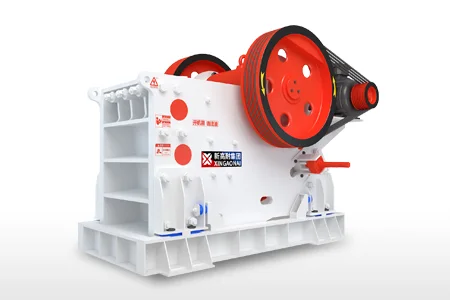
| Primary crushing | PEV Series jaw crusher |
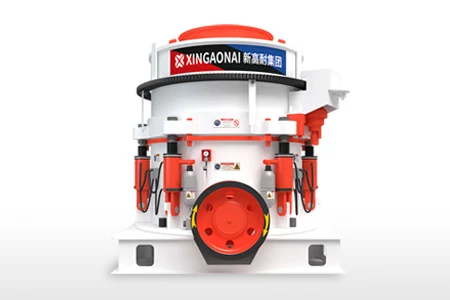
| Secondary/fine crushing | XHP multi-cylinder hydraulic cone crusher |
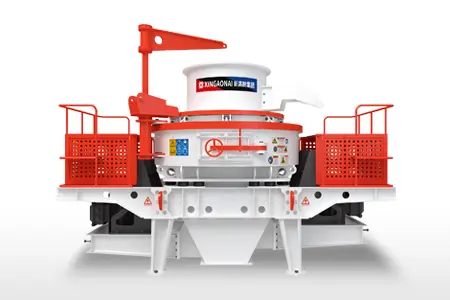
| Shaping | VSI vertical shaft impact crusher |
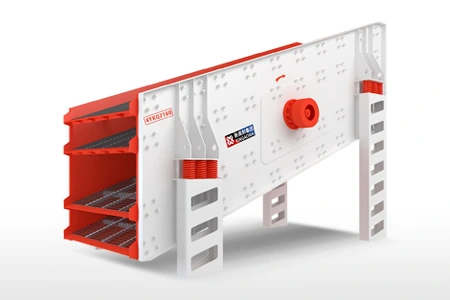
| Screening | Two YKQ Series vibrating screens |
The jaw crusher performs the initial size reduction. The XHP multi-cylinder hydraulic cone crusher provides further crushing before the material reaches the shaping and classification stages.
The VSI vertical shaft impact crusher forms a separate shaping stage. This arrangement avoids requiring the primary crusher to produce the final particle shape by itself.
The two vibrating screens classify the material into the specified commercial fractions. This is important because particle shape should be assessed together with the actual product fraction.
The operating footage can demonstrate:
Actual equipment operation;
Material movement between stages;
Feed continuity;
Crusher loading;
VSI shaping arrangement;
Screening and final discharge.
However, no laboratory flakiness-index report is available for this project. The video and configuration therefore illustrate process design and operating inspection points; they do not prove that a particular FI value was achieved.
No laboratory flakiness-index report was available for this project. The operating footage is used to illustrate equipment configuration and inspection points, not to claim compliance with a particular FI limit.
Representative samples from the finished coarse-aggregate fractions would need to be tested according to the project standard before reporting an FI result.
Information to Record Before Changing the Crusher
Prepare the following information before requesting equipment or process recommendations:
Material type and photographs;
Maximum feed size;
Feed-size distribution;
Required capacity;
Current production flow sheet;
Crusher manufacturer and model;
Chamber and liner type;
Liner condition and operating hours;
Measured CSS;
Finished product fractions;
FI report for each applicable fraction;
Sampling and test standard;
Allowable fines percentage;
Project location and application.
Without this information, changing a crusher or adding a shaping machine may not address the real cause.
Conclusion
The flakiness index is useful for identifying coarse-aggregate particle-shape problems, but the result should not be interpreted in isolation.
A reliable investigation connects the laboratory result with:
Rock source;
Feed gradation;
Crusher loading;
CSS;
Chamber and liner condition;
Crushing ratio;
Screening;
Recirculating load.
The Cambodia production line demonstrates how primary crushing, cone crushing, VSI shaping and screening can be assigned to separate stages. Because no laboratory FI data are available, the project should be presented as a real operating and process-design example rather than a verified FI-reduction case.
To evaluate a crushing circuit, provide the material, feed gradation, capacity, product sizes, equipment models, measured settings, liner condition and available particle-shape test results.